Field validation
We didn't model it.
We measured it.
Every number below was captured on real streets, in real traffic, on a real body — in Bengaluru, one of the hardest air-quality environments on Earth to instrument.
Hyperlocal, or it doesn't count
One city. One "AQI".
A hundred different truths.
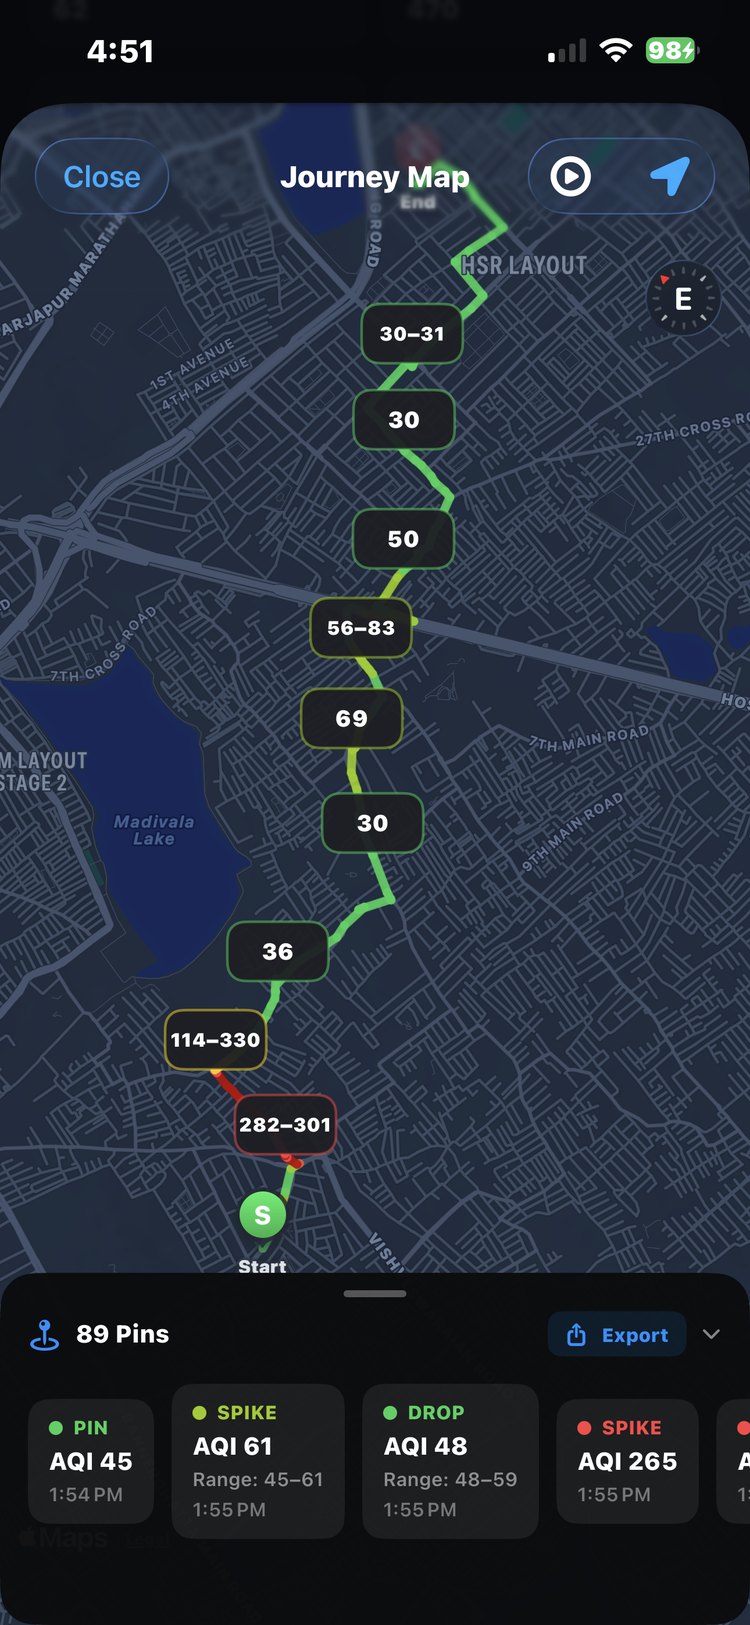
On a single Bengaluru commute, Securio pinned readings from 71 to 320 — within a few kilometres of each other, minutes apart.
A city-average AQI flattens all of that into one number measured somewhere you aren't. Securio's journey pins reveal the streets, junctions and hours where your real exposure spikes — the kind of map no static station network can draw, because it's anchored to a moving body, not a fixed post.
The experiment that matters
Active commutes vs. control:
a 3.4× difference you can feel.
127.0
Mean AQI — active commute
Measured on-body while moving through Bengaluru traffic.
37.8
Mean AQI — control
The same instrument, away from active exposure.
3.4×
The gap
Statistically decisive (p ≈ 9.4 × 10⁻⁵⁶, Cohen's d = 1.29). Your commute is not a rounding error in your health.
Internal sensor consistency across the validated corpus: R² = 0.9958 (minimum AQI vs. AQI) and R² = 0.9975 (maximum AQI vs. AQI) — the readings agree with themselves, session after session.
How we report it
Honest numbers, stated precisely.
Tested in three cities
The Securio device has been field-tested in Bengaluru, Delhi and Pune — different climates, traffic patterns and pollution profiles.
Validated in one
The systematic validated dataset — every figure on this page — is from Bengaluru, where continuous data logging ran throughout the validation window. We say exactly what we measured, and where.
Validation completed on a bootstrapped ₹1.3 Crore. TRL-7: operational validation complete. Securio is heading toward commercial launch.
Want the dataset story from the founder's seat?
We publish the validation series as it happens.
Read the validation series